Methodology
How the probabilities on this site are produced, settled and scored. Written so that every number can be checked.
Last updated: October 10, 2026
1. The model
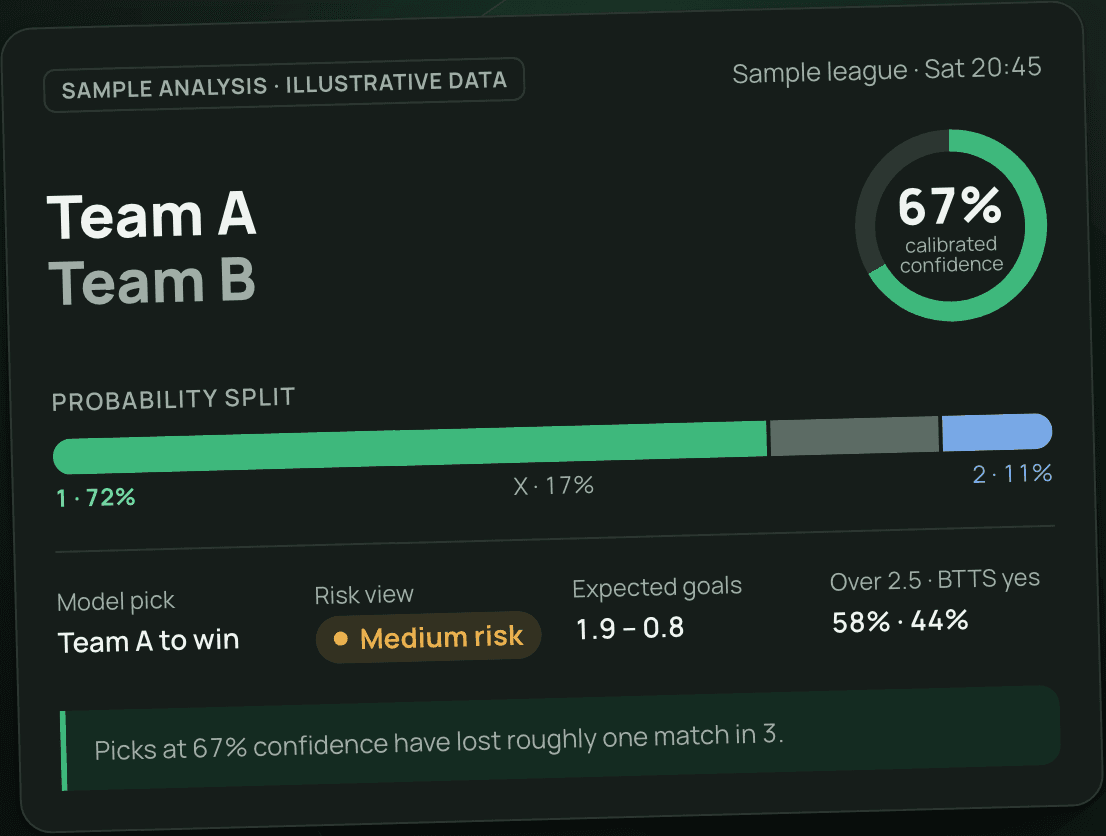
Match probabilities come from a Dixon-Coles model. Each team gets an attack and a defence strength, and there is one home-advantage term per league. The expected goals of the two sides follow from those parameters; the score distribution is a pair of Poisson counts with the Dixon-Coles adjustment that corrects the probability of 0–0, 1–0, 0–1 and 1–1, which plain Poisson gets wrong.
Parameters are fitted per league by maximum likelihood on results from the last 540 days. Older matches count less: a result loses half its weight every 180 days, so the current form of a squad dominates the fit without last season disappearing entirely.
The score grid runs to 10 goals per side. From it we read 1X2, over/under lines, both-teams-to-score, the most likely scores and Asian handicap cover probabilities. The headline 1X2 figures use the Dixon-Coles adjustment; the goal grid shown on a match page is the raw Poisson grid, which is why its 1X2 split can differ by a point or two.
2. What is not in the model
- Line-ups, injuries and suspensions
- Expected goals (xG) or shot data
- Weather, travel, fixture congestion, motivation
- Betting-market prices (odds are captured for comparison, never fed into the probabilities)
This is deliberate. A results-only model is easy to audit and does not depend on paid data. It is also why the model is weakest at the start of a season and around cup ties on neutral ground.
3. Probability, not certainty
Every figure on a match page is a probability: the share of times an outcome would happen if the same match were played many times under the same conditions. A 60% home win is not a forecast that the home side will win. It says the home side should win about six times in ten, and the other four are expected, not errors.
That is why the record is judged with calibration and the Brier score rather than by counting hits alone. A model that gives 60% to picks that land 60% of the time is doing its job even while it loses two in five. The confidence next to a pick is the calibrated version of that probability, and the Low / Medium / High risk label summarises how often picks at that level have lost.
Nothing on this site guarantees an outcome, and no page is advice to bet. Treat the numbers as an estimate with an error bar, compare them with the market, and keep any stake within what you can afford to lose.
4. The markets: 1X2, over/under 2.5, both teams to score
- 1X2 (match result): 1 = home win, X = draw, 2 = away win after 90 minutes plus stoppage time; extra time and penalties do not count. The three probabilities add up to 100%.
- Over/under 2.5 goals: whether the match has three or more goals (over) or two or fewer (under). The 2.5 line cannot be hit exactly, so there is no push.
- Both teams to score (BTTS): yes if each side scores at least once, no otherwise, regardless of the result.
- Double chance (1X, X2, 12) is derived from the 1X2 figures by adding two of them.
All three are read from the same score grid. The pick in each market is the side with the higher model probability; the calibrated confidence next to it uses a separate curve per market, because the model is not equally good at all three.
5. Model expected goals are not xG
A match page shows an expected number of goals for each side (λ, lambda). It is the mean of the Poisson distribution the model assigns to that team's goals, derived from attack and defence strengths and home advantage. It is a pre-match estimate from past scorelines only.
Expected goals (xG) as published by data providers is a different quantity: it sums the quality of the shots a team actually took in a match, from shot location, type and build-up. xG is measured after the fact from event data; the model's λ is predicted before kick-off from results. The two often agree in direction and differ in level, and the model does not use xG as an input.
6. Coverage
Predictions are published only for leagues the model has been fitted on. A league is added when it has enough results in the training window (at least 120 matches) and is left out otherwise. Fixtures outside covered leagues can appear in the schedule but carry no model rating and are never counted in the record.
Feed league identifiers change every season, so a league is matched by its name and country code, with a fixed list of canonical identifiers as a fallback.
7. Picks, confidence and calibration
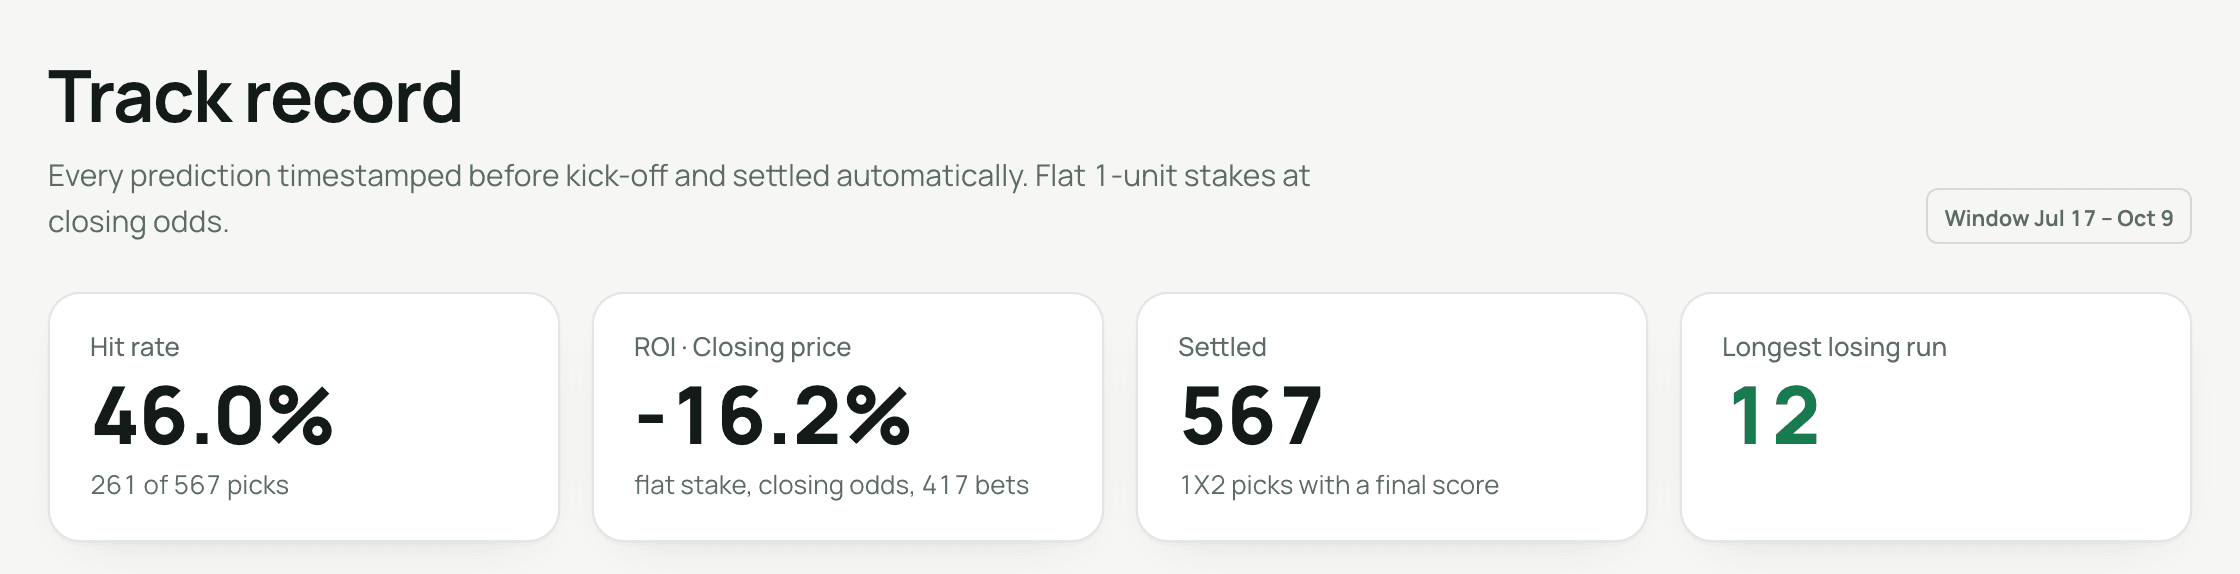
The pick is the outcome with the highest model probability. The confidence shown next to it is that probability after calibration.
Calibration is an isotonic regression (pool-adjacent-violators) fitted on settled picks: it maps the raw model probability to the share of picks that actually landed at that level. The curve is monotone, uses at most 40 knots and is only applied once at least 30 settled picks exist. It is refitted as results come in, so the same raw probability can map to slightly different calibrated values over time. Match pages show both numbers.
Over/under 2.5 and both-teams-to-score picks are the side the model favours; their calibrated probabilities use separate curves fitted per market.
8. Settlement
An hourly job compares every published prediction with the final score once the feed reports the match finished. A 1X2 pick is won when the actual outcome matches; goal-market picks are settled from the final score. Predictions are never edited after kick-off and never removed after settlement.
Matches marked as finished without a usable score (postponed, abandoned or missing from the feed) are kept out of the record and listed separately on the results page with a count.
9. How the record is scored
- Hit rate: share of settled 1X2 picks that won.
- Brier score (1X2): mean over matches of the sum of squared errors across the three outcomes; 0 is perfect, 0.667 is a uniform guess, and the market's margin-free prices typically score about 0.60 in top leagues.
- Brier score (goal markets): binary version, where 0.25 is a coin flip.
- Calibration table: settled picks grouped by calibrated confidence, comparing the mean predicted probability with the observed hit rate.
- Flat-stake ROI: one unit on the model pick at the last odds captured before kick-off (closing, otherwise opening), summed over matches that have an odds snapshot. Returns are shown before any bookmaker limits or account restrictions, which real bettors face.
All figures are computed from the same settled rows shown on the results page, recomputed hourly, and include losing months.
10. Data sources and timing
Fixtures, results and team data come from a third-party football data feed. Odds snapshots come from a bookmaker feed and are captured at opening and shortly before kick-off. The public site reads from our own database and refreshes predictions every 15 minutes, results every 5 minutes and aggregates every hour. Kick-off times are shown in your browser's time zone, with Europe/Zurich as the fallback.
Freshness in plain terms: a fixture appears on the public match pages once the engine has rated it, usually the evening before; league tables refresh every six hours; results are checked hourly once the feed reports full time. Each match page prints the time of the last data write for that match, so a stale page is recognisable as such.
11. Known limitations
- The public record starts in late July 2026; the settled sample is still small and league-level figures swing.
- Odds snapshots exist only from mid-August 2026 and not for every match, so the ROI window is shorter than the record.
- The feed occasionally lags or omits a result; such matches stay unsettled until it arrives.
- Probabilities are estimates. A 60% pick is expected to lose two times in five.